
The Call Stack, Memory Heap, and Execution Context in JavaScript
To write high-performance web applications, you must look beyond JavaScript syntax and understand how the engine executes code and manages memory at runtime.
At runtime, the JavaScript engine (such as V8 in Chrome/Node.js or JavaScriptCore in Safari) coordinates three core components: the Execution Context, the Call Stack, and the Memory Heap. Misunderstanding how these pieces interact is the root cause of issues like memory leaks, UI freezes, and RangeError: Maximum call stack size exceeded errors.
1. What is an Execution Context?
The Execution Context is the environment created by the JavaScript engine to evaluate and execute code. Think of it as a wrapper container that holds all the metadata, scope chains, variables, and context-specific properties needed to run a block of code.
Types of Execution Contexts
- Global Execution Context (GEC): The default context created when your script starts. It does two things: creates the global object (
windowin browsers,globalin Node.js) and sets the value ofthisto the global object. There is only ever one GEC per execution environment. - Function Execution Context (FEC): Created dynamically every single time a function is invoked. Each function call gets its own distinct execution context.
- Eval Execution Context: Created when code is executed inside the
eval()function (generally avoided due to security and performance implications).
The Lifecycle Phases of an Execution Context
Every execution context goes through two distinct phases before it is executed:
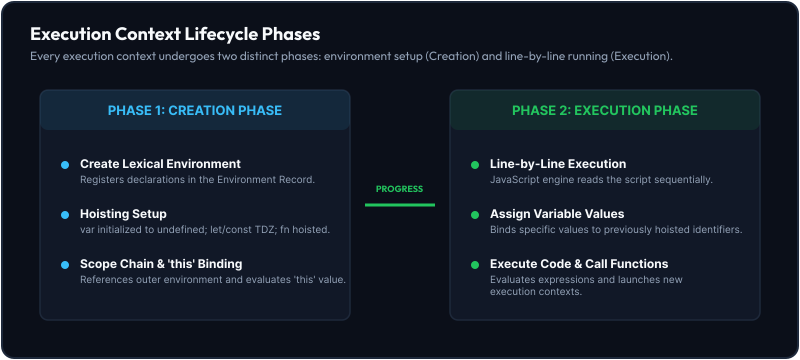
Phase A: Creation Phase
Before a single line of JavaScript code executes, the engine sets up the environment:
- Lexical Environment & Variable Object (VO):
- Registers function declarations and loads them entirely into memory.
- Registers variables declared with
varand initializes them toundefined. This process is known as hoisting. - Registers block-scoped variables (
let,const) but leaves them uninitialized. They remain in the Temporal Dead Zone (TDZ) until their declaration line is executed.
- Scope Chain Setup: Creates a reference chain to outer lexical environments, enabling lexical scope lookup.
thisBinding: Resolves the reference object for thethiskeyword.
Phase B: Execution Phase
The engine reads and executes the code line-by-line. It assigns values to variables, resolves function calls, and runs expressions.
2. The Call Stack (Execution Tracking)
The Call Stack is a LIFO (Last In, First Out) data structure used by the JavaScript engine to track the active function calls and their execution order.
- When a function is called, the engine creates its Function Execution Context (FEC) and pushes it onto the top of the stack.
- The engine always executes the context at the very top of the stack.
- When the active function finishes executing, its FEC is popped off the stack, and execution resumes in the calling context below it.
Step-by-Step Execution Context Trace
Let's see how the engine manages the stack during the execution of this code:
const userName = "Alice";

function greet(name) {
  const message = `Hello, ${name}!`;
  printMessage(message);
}

function printMessage(msg) {
  console.log(msg);
}

greet(userName);
Here is how the Call Stack evolves:
-
Script Start:
- The engine creates the Global Execution Context (GEC) and pushes it to the bottom of the stack.
- During the creation phase,
userNameis registered (TDZ), and function definitionsgreetandprintMessageare hoisted. - During the execution phase,
userNameis assigned"Alice".
-
Line 11 (
greet(userName)):- The engine calls
greet("Alice"). - It pauses GEC, creates an FEC for
greet, and pushes it onto the stack. - Stack State:
[ GEC ] -> [ FEC: greet ]
- The engine calls
-
Inside
greet(printMessage(message)):- The variable
messageis evaluated as"Hello, Alice!". - The engine calls
printMessage("Hello, Alice!"). - It pauses
greet's FEC, creates an FEC forprintMessage, and pushes it onto the stack. - Stack State:
[ GEC ] -> [ FEC: greet ] -> [ FEC: printMessage ]
- The variable
-
Inside
printMessage(console.log(msg)):console.logis called and executed.- Once complete,
printMessageterminates. - Its FEC is popped off the stack.
- Stack State:
[ GEC ] -> [ FEC: greet ]
-
Back in
greet:- There are no more statements.
greetterminates, and its FEC is popped off.- Stack State:
[ GEC ]
-
Script End:
- The program is finished. The GEC is popped off, and the stack is empty.
Stack Overflow
Stack memory is fixed and limited. If you push too many execution contexts onto the stack without popping them off, the engine throws a RangeError: Maximum call stack size exceeded (a Stack Overflow).
// Example: Infinite recursion with no base case
function recurse() {
  recurse();
}
recurse(); // RangeError: Maximum call stack size exceeded
3. The Memory Heap (Object Storage)
The Memory Heap is a large, unstructured, and dynamically-allocated memory pool. While the Call Stack handles small, fixed-size data (primitives like numbers, strings, and object reference pointers), the Memory Heap is where JavaScript stores larger, dynamically-sized reference values: Objects, Arrays, Functions, and Closures.
Because these reference values can grow dynamically at runtime, they cannot be stored in the rigid, sequential structures of the stack. Instead:
- The engine allocates space for the object in the Memory Heap.
- It assigns a unique memory address (reference pointer) to that space.
- It stores this memory address as a fixed-size reference variable on the Call Stack.
Visualizing Stack vs. Heap Allocation
Consider this code:
let score = 100; // Primitive: Stored directly on the stack
let user = {
  // Object: Reference pointer on stack, object on heap
  name: "Charlie",
  skills: ["JS", "React"],
};
let anotherUser = user; // Reference pointer copied on the stack
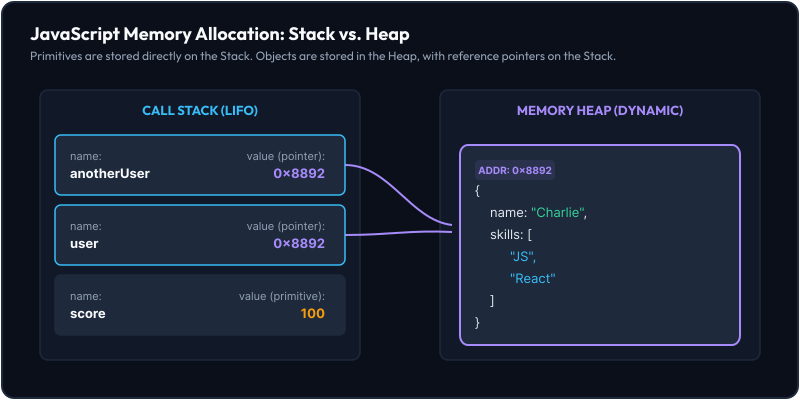
Here is how the data structures look conceptually in memory:
Mutation Behavior & Reference Sharing
Because anotherUser was assigned user, they both point to the exact same memory address (0x8892).
If you mutate the object using anotherUser, it affects user because they share the underlying heap reference:
anotherUser.name = "Bob";
console.log(user.name); // Output: "Bob" (Mutating one affects both!)

// Reassigning one to a primitive does NOT affect the other
anotherUser = null;
console.log(user.name); // Output: "Bob" (user still retains the heap reference)
4. Stack vs. Heap: Comparison Matrix
| Property | Call Stack | Memory Heap |
|---|---|---|
| Data Structure | Stack (LIFO - Last In, First Out) | Heap (Unstructured, dynamically sized) |
| Type of Data | Primitives (String, Number, Boolean, Symbol, Null, Undefined, BigInt) and Reference Pointers | Objects, Arrays, Functions, and closures |
| Size | Fixed, small, and environment-limited | Large, dynamic, and system-limited |
| Allocation | Managed automatically by the engine's execution flow | Managed dynamically at runtime |
| Access Speed | Extremely fast (immediate access by offset) | Slower (requires pointer/reference resolution) |
| Errors | Stack Overflow (RangeError: Maximum call stack size exceeded) | Out of Memory (Fatal error: JavaScript heap out of memory) |
5. Garbage Collection and Memory Management
Since the Memory Heap has finite space, the JavaScript engine must regularly release memory for objects that are no longer needed. This process is automated via Garbage Collection (GC).
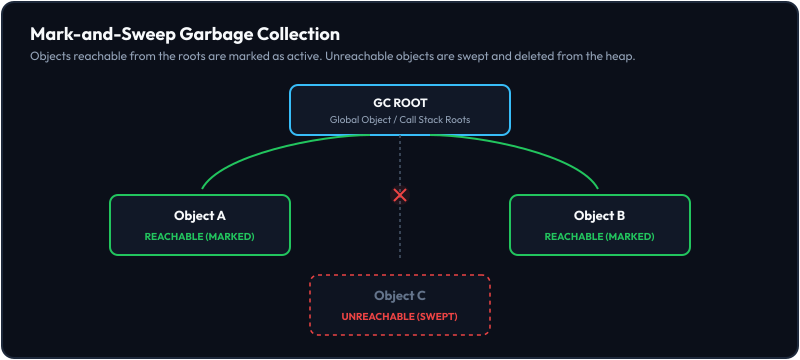
Modern engines use a Mark-and-Sweep algorithm to identify and clean up unused memory:
- Roots: The GC starts with a set of "roots"—typically global variables, active variables on the Call Stack (current execution contexts), and built-in API objects.
- Marking: The GC recursively traverses from the roots and follows all object references. Any object it can reach is "marked" as reachable.
- Sweeping: The engine scans the entire Memory Heap and deallocates (sweeps) the memory of any object that was not marked (unreachable).
The Difference: Reference Counting vs. Mark-and-Sweep
- Reference Counting (Legacy): Simply tracked how many references pointed to an object. When references hit
0, the object was collected. This suffered from circular reference leaks:function createCycle() { let obj1 = {}; let obj2 = {}; obj1.prop = obj2; // obj2 referenced by obj1 obj2.prop = obj1; // obj1 referenced by obj2 } createCycle(); // obj1 and obj2 are unreachable, but their reference counts are still 1. // Legacy engines would leak this memory. - Mark-and-Sweep (Modern): Because
obj1andobj2cannot be reached from any root (like the global object or active Call Stack), they are not marked and are successfully swept and garbage collected.
6. Common Interview Coding Pitfalls (Memory Leaks)
Trap #1: Closure-Induced Memory Leak
Explain how the memory footprint behaves in this code and how to fix it:
// BEFORE (Memory Leak)
function makeLeaker() {
  const giantData = new Array(1000000).fill("Confidential Data");

  return function () {
    // This closure references NOTHING explicitly from giantData, but...
    console.log("Closure is running");
  };
}

const leak = makeLeaker();
// giantData cannot be garbage collected as long as leak() exists!
Why it happens:
JavaScript closures retain a reference to the entire lexical environment in which they were created. Even if the inner function doesn't explicitly reference giantData, modern engines might fail to optimize it out if the engine cannot guarantee safety, or if multiple closures share the same scope environment.
How to fix it: Ensure you release reference variables manually if they are large, or structure the code so the closure only encapsulates what it needs:
// AFTER (Fixed)
function makeLeaker() {
  let giantData = new Array(1000000).fill("Confidential Data");

  const fn = function () {
    console.log("Closure is running");
  };

  // Explicitly nullify the large object reference before returning
  giantData = null;
  return fn;
}

const leak = makeLeaker(); // giantData is freed!
Trap #2: Unintentional Global Variables
What is the memory risk here and how do we prevent it?
// BEFORE (Memory Leak)
function processData() {
  largeObject = { data: new Array(500000) }; // Missing var/let/const
}
processData();
Why it happens:
When you assign a value to a variable without declaring it using var, let, or const, JavaScript automatically attaches it to the global object (window in browsers). Because the global object is a GC Root, largeObject will remain in the Memory Heap permanently until the browser tab is closed.
How to fix it:
Always declare variables, or enforce Strict Mode ('use strict'), which throws a ReferenceError when assigning to undeclared variables:
// AFTER (Fixed)
function processData() {
  "use strict";
  const largeObject = { data: new Array(500000) }; // Safely scoped to function
}
processData(); // largeObject is swept by GC after function completes
Trap #3: Forgotten Timers or Callbacks
What memory leak occurs here when the component is unmounted?
// BEFORE (Memory Leak)
function startTracking(buttonElement) {
  const largeConfig = { id: 102, data: new Array(500000) };

  setInterval(function () {
    if (buttonElement) {
      console.log(`Tracking event for ID: ${largeConfig.id}`);
    }
  }, 1000);
}
Why it happens:
The callback inside setInterval holds a reference to buttonElement and largeConfig via closure. Even if buttonElement is removed from the DOM, the interval remains active, meaning both the callback, the DOM element, and largeConfig are kept in the Memory Heap indefinitely.
How to fix it: Always capture the interval ID and clear it when the resource is no longer needed (e.g., component unmounting):
// AFTER (Fixed)
let intervalId;

function startTracking(buttonElement) {
  const largeConfig = { id: 102, data: new Array(500000) };

  intervalId = setInterval(function () {
    if (buttonElement) {
      console.log(`Tracking event for ID: ${largeConfig.id}`);
    }
  }, 1000);
}

function stopTracking() {
  clearInterval(intervalId); // Frees the callback and everything it references
}
7. Key Takeaways
- Execution Context is the environment wrapper where your code runs, featuring a creation phase (hoisting and scope binding) and execution phase.
- Call Stack is a fast, LIFO structure that tracks executing function contexts and stores primitives and pointers.
- Memory Heap is a large, unstructured pool for dynamic allocations of objects, arrays, and functions.
- Mark-and-Sweep garbage collection checks reachability from global and stack roots to clean up unused heap allocations.
- Common leaks include closures containing unused references, undeclared global variables, and active timers/event listeners that retain references to deleted DOM nodes.